")

Heatmaps in all shapes and sizes have been around for quite sometime. You may have seen them representing the intensity of a tropical storm or used for visually measuring the depth of the seabed. While their application in web design is not new, injecting them with real-time analytics is, and it’s an exciting development for those of us obsessed with digital marketing.
What are heatmaps?
In digital marketing, heatmaps (or heat maps) use colour to visualise data. This could be the aggregated clicks and user interactions of a banner ad, website, or other interactive application. While you’d likely recognize a heatmap if you saw one, there’s no common standard as to how heatmaps are read. But generally, red, orange, and yellow areas on a heatmap show higher user interaction. While areas of green and blue equate moderate interest.
Some commentators see heatmaps as a form of visual storytelling; helping convey information that may otherwise remain hidden or difficult to determine. Due to this unique capability heatmaps are used in many applications, from validating the A/B testing of an e-commerce landing page, to placing a call-to-action (CTA) on a blog. They are a great tool for visually combining analytics data and activity.
Google has even introduced heatmaps for 360-degree and VR videos on YouTube. This means content creators can see exactly what parts of a video are catching a viewer’s attention and how long they’re looking at a specific part of the video.
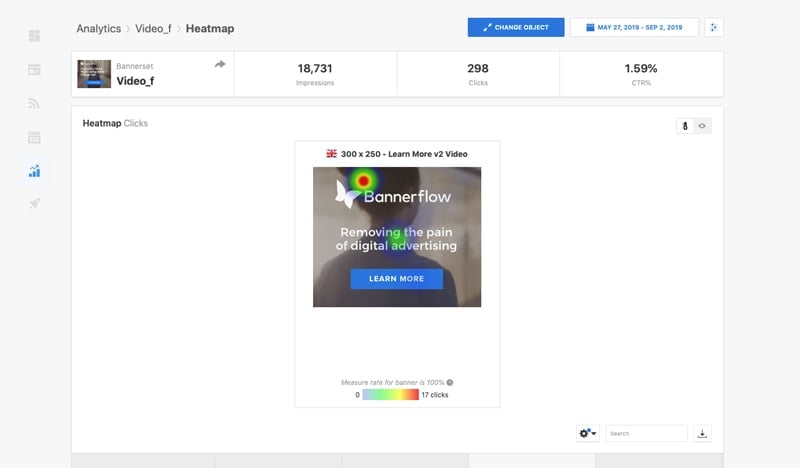
In display advertising heatmaps typically show where a click has been made.
Improving banner design
In terms of improving display advertising, heatmaps are a valuable tool for designers. They assist designers in finding out which specific objects in the banner creative are working. This could include buttons, copy position, or the products featured in a banner.
By using heatmaps designers can answer these creative questions and more. In particular, it is quickly established if there are any distracting elements diverting attention from conversion objectives. Or, if viewers are missing out on the CTA because it is difficult to spot.
Moreover, heatmaps allow designers to make informed creative decisions. According to Bannerflow Product Specialist, Sanna Nordgren, “heatmaps assist designers in creating efficient and engaging banner designs”. For example, when scaling out a design, heatmaps can assist in creating standardised design across formats and layouts. They help to find out what looks good! Combining heatmaps and data tells a brand what works well and what doesn’t. It also means consistent creative across banner campaigns.
Optimising display campaigns with heatmaps
Where heatmaps come into their own is when they are used to help optimise banner ads.
Banner optimisation should always be part of a campaign. After all, if you have good results you want to see what’s driving performance? Likewise, what isn’t working well. There might be many objects, across many banner variants. Knowing which object is the strongest driver of clicks via data and heatmaps can improve future campaign performance. Better still, combine this with a creative management platform that lets you update your banners in real-time! Problems are then dealt with instantly, and ad spend saved.
Another neat feature of heatmaps is better A/B testing. When testing, two banners may have similar click-through rates, which makes optimisation difficult. A/B test with heatmaps and an extra layer of performance data becomes clear. Designers can see which banner is more successful in terms of effective design. For example, is a banner getting clicks in spite of its poor design? Are clicks made on a desired object, or is a CTA obscured? Creative can always be improved to drive viewer interest. The lesson: A/B test your banners. Use heatmaps, and you gain even more insight into a campaign.
Heatmaps and Bannerflow
The development of analytics within display advertising is providing ever greater insights. The feedback loop between marketers, designers, and their display advertising is now better than ever. At Bannerflow, analytics, and how data is interpreted, is a key tool for those producing display campaigns.
Bannerflow (along with other platforms) provides an extra metric when producing heatmaps: measure rate. All reliable heatmaps have a measure rate. This provides the user with an accurate assessment of the click locations of a banner. The higher the measure rate, the more valid the data and accurate the heatmap. Likewise, the more clicks your banner has, the greater the accuracy of the measure rate too.
Transparency across metrics and analytic means marketers are able to interpret data correctly. Unfortunately, it’s unlikely you’ll be able to map 100% of all clicks for a banner, as sometimes a click is registered but the location clicked is not. This is good to know when analysing heatmaps – otherwise you may get a false impression. After all, it’s better to make an informed decision, rather than a glorified guess!
Bannerflow is continuously developing its heatmap tool too, with time-stamping coming to heatmaps of animated HTML5 banners. Meaning users of the platform can see where in an animation a banner has been interacted with. For a banner with multiple CTAs this could prove highly informative. While, for both static and animated banners, mouse hovering data will provide even more data for Bannerflow heatmaps.
Ad fraud and transparency
Without a doubt heatmaps improve banner performance but they’re also pretty useful for avoiding ad fraud, and improving transparency. By seeing the location of clicks you can set up rules to detect and filter invalid traffic.
Heat maps detect click fraud because bots tend to click on the same spot every time. For example, many bots click the first top-left pixel. Or they create a pattern, clicking in an exact straight line, or in the exact centre of a banner. Recognising these patterns, via the use of a heatmap, means bots are eliminated from any stats. Here at Bannerflow we constantly analyse any patterns from heatmaps to fight this fraud.
Then there are issues surrounding transparency. Issues of which, as we know, are on the minds of digital marketers across the world. According to Bannerflow’s Product Owner Björn Karlström, when analysing heatmaps, “Yes, always analyse your own data – but if you often see patterns then you need to start working with an ad fraud detection partner or review the publishers you use. You don’t want to be constantly monitoring because of bots”. Heatmaps can signal whether you’re getting the protection your brand needs.
Conclusion
Heatmaps and better banners go together. Not only do they aid creative choices, and improve campaign optimisation but they also help combat bots. An awesome combination! They are another weapon in the display ad armoury that digital marketers must have at their disposable.
Here at Bannerflow heatmaps are an important part of our creative management platform. After all helping brands to produce remarkable display advertising is what we’re all about! But whoever produces your display campaigns, whatever platform you use, heatmaps are another way of improving banner design, and ultimately, your conversions.

")